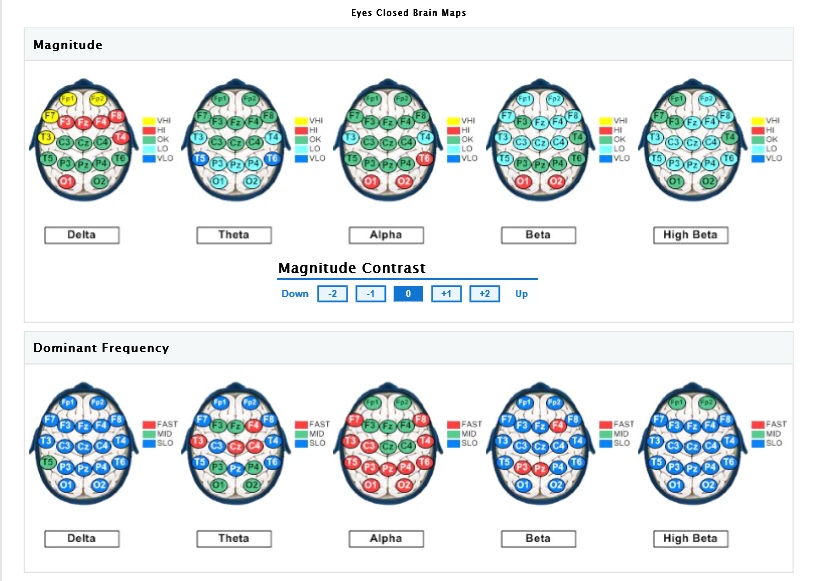
Quantified ElectroEncephaloGraphy is the analysis of digitized EEG recordings that paints a highly-detailed portrait of an individual's brain-functioning at the time of recording, but also provides an opportunity for an educational endeavor regarding the optimums and sensitivity of the Brain, Central Nervous System and Autonomic Nervous System. Brain maps are recorded by placing sensors on the scalp at site-specific locations that measure the electrical activity of the brain and surrounding environment. This information is sent from these sensors to an adapter/amplifier which amplifies the signal so that it can be processed by a software program. The program allows for complex algorithms like the "Fourier Transform Analysis" to analyze EEG data and separate the total EEG information into sub-wavelength ratios of varying frequencies and waveforms. The end result can be visualized below.
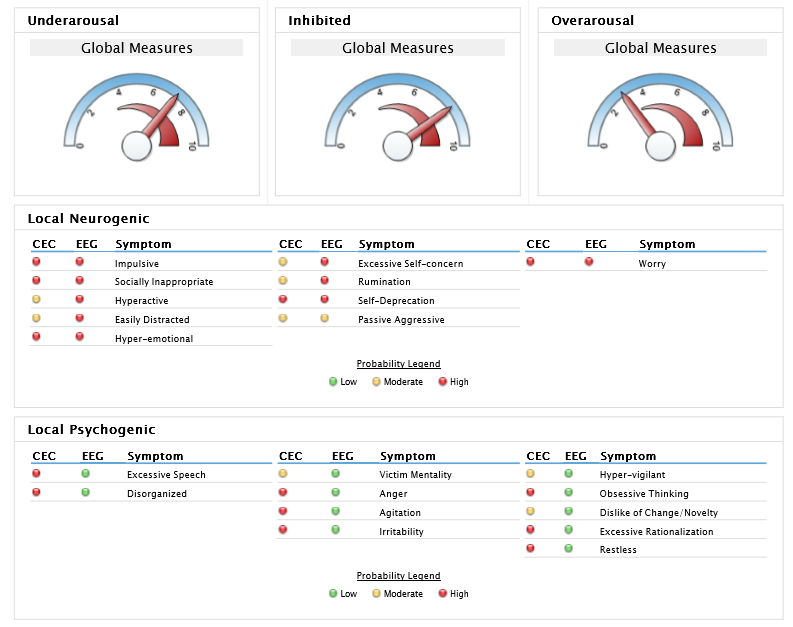
A ton of data can be pulled from a single brain map. The above images show the physical brain in different stimulatory states (depicted by brainwave ratios) at site-specific locations. In order to process and make sense of this data, decades of study have began to associate the performance of particular neuronal clusters to particular behavioral trends. Since the brain is best compared to a super-computer and our bodies are best compared to a vehicle, an easy way to relay this type of information is via "a neuro-speedometer" or "emotional dashboard" as depicted below.
From one brain-map and the associated self-reporting profiles, personalized recommendations for vitamin and mineral supplementation can be tailored to an individual, but most importantly Neurofeedback Protocol Recommendations are provided, specific to your brain-wave signature.
Physiology Metabolism Make UP
Online Self-Reporting Questionnaire that correlates symptomology to physiologic performance and organ system coherence.
Interactive Self Inventory
Online Self-Reporting Questionnaire that provides dimensional analysis of an individual's personality. This report compares the individual taking the questionnaire to "Peak Performers" and the "Average Norm" for each trait.
Cognitive Emotional Checklist
Online Self-Reporting Questionnaire that provides predictive measures of neuro-functioning and behavior traits that are compared to a physical qEEG brain-map.
Games for Specialized Testing
Once the entire profile and brain map are established, there are some fun, challenging games focused at scoring & enhancing specific neuro-processes like memory recall, sequential memory, audio/visual processing and others.